Thursday, March 31, 2011

Argatroban

Critically ill patients receiving continuous renal replacement therapy are frequently given heparin to maintain circuit patency. In the presence of active HIT-II or HITT, even in the absence of clinical thrombosis, systemic anticoagulation with a direct thrombin inhibitor (DTI) decreases the incidence of thrombotic complications, if given until thrombocytopenia has resolved. In this scenario, anticoagulation to maintain CRRT circuit patency is a bonus. In critically ill patients requiring CRRT with a history of HIT-II, but not active thrombocytopenia or thrombosis, avoidance of heparin exposure is still recommended, and argatroban is currently a common choice of DTI if systemic anticoagulation is required. As this is a drug that nephrologists need to be very familiar with, here's a list of essential facts about argatroban in the form of a mnemonic, for those of you who get off on that kind of thing.


A nticoagulant of choice in active HIT-II or HITT.
R enal dose adjustment not necessary – hepatically cleared only.
G oal aPTT is 2-3 times above baseline (as for heparin).
A ctivated PTT is monitoring test of choice, but note argatroban increases ACT and PT/INR also.
T wo mcg per kg per minute is the usual starting dose (2mcg/kg/min)
R eversal not possible, so careful monitoring essential.
O .5 mcg/kg/min starting dose in liver disease (0.5mcg/kg/min)
B olus not required before infusion (unlike heparin). Steady state within 3 hours.
A lbumin: Low albumin is an important clue to hepatic synthetic dysfunction. Reduce starting dose by 75% if present.
N ormalised ratio: When transitioning to warfarin, once the INR is 4 while on both drugs, the INR will be therapeutic once the argatroban infusion is stopped. The alternative is the measure the chromogenic factor x level (goal less than 45% for efficacy).

Wednesday, March 30, 2011

Sodium – interpretation of measurements

Sodium is the most abundant extracellular cation in humans. The concentration in the extracellular fluid is highly influenced by the amount of fluid it is dissolved in – the reason why we always say that most low sodium problems are actually problems of too much water.

There is an important difference between sodium concentration and sodium activity. The concentration simply refers to the total amount of sodium present per unit volume, whereas the activity refers to the amount of free sodium ions that are free to enter a chemical reaction and are not complexed to other plasma constituents, e.g. proteins. Due to historical convention sodium tends to be reported in terms of it’s concentration rather than true activity.

Believe it or not, if we were able to measure the exact amount of sodium in a litre of blood, it would only be in the region of 84mmol. This is because blood contains around 40% red cells, which have little or no sodium content.
If we then tried to figure out the concentration of sodium in the remaining 0.6 litres of ‘fluid’ in blood (84/0.6) we would get a figure of 140mmol/L.

However, remember that in normal circumstances plasma is only 93% fluid; the remainder being composed of proteins, lipids etc.. So, in actual terms, the true plasma water sodium concentration is (140/0.93), or around 151mmol/L.

This knowledge will help explain the concept of pseudohyponatraemia associated with hyperlipidaemia or hyperproteinaemia. In these scenarios, the plasma water content per litre of plasma is reduced from 93% to let’s say 80% for example.
If the lab reported that our patient’s sodium was 120mmol/L then we can try to calculate what the true plasma water sodium concentration is:

120/0.8 = 150
This is similar to the true plasma water figure in our normal patient, who had a sodium of 140mmol/L and plasma water content of 93%.

This should also explain why we call ‘normal saline (0.9%)’ an isotonic fluid, even though when you read the chemical composition label, you will find that it contains 154mmol/L of sodium ions and 154mmol/L of chloride ions.

Next week I’ll try to delve into the various ways that sodium has been measured in clinical laboratories.

Friday, March 25, 2011

‘Failure to thrive’ on PD

A few months ago I took care of a patient who, having been on peritoneal dialysis for a number of years, was losing weight, had poor small solute clearances and worsening edema. We transitioned her over to HD for presumed membrane failure, but her nutritional status really did not improve. She continued to complain of nausea, vomiting and abdominal bloating - an abdominal CT gave us the answer. It showed loculated fluid collections, markedly thickened peritoneal membrane and tethering of the bowel in the centre of the abdomen (as in left image). The entire presentation was consistent with encapsulating peritoneal sclerosis (EPS) – a dreaded complication of long term PD.
EPS is quite rare, but has a high associated mortality (25-50%). It is relevant even for those of us who take care of few/no PD patients, as over half of all cases present after changing from PD to HD and it can even present post renal transplantation.
So what is EPS? Basically, it is an inflammatory condition, characterized by severe peritoneal fibrosis and thickening, leading to adhesions, small bowel obstruction and ascites formation. It occurs in between 0.5- 2.8% of PD patients and is seen primarily in patients who have been on PD for over 5 years, with risk increasing as time on dialysis increases (Up to 17% in those on PD over 15 years). However, there have been reported cases in patients on PD for less than 6 months. Frequently, patients have had recurrent episodes of peritonitis although again, this is not universal. Infection is thought to ‘prime’ the membrane for fibrotic change and may be a precipitating event.
The clinical presentation can be quite vague, so a high degree of suspicion is needed to make the diagnosis. Patients may present as ‘failing’ PD but EPS should be considered in any patient with persistent GI symptoms and declining nutritional status either while on PD or after transfer to HD. Commonest complaints include decreased appetite, early satiety, nausea and vomiting. Recurrent episodes of small bowel obstruction are seen in severe cases. In the right clinical setting, bloody dialysate (PD) or recurrent +/- bloody ascites (HD) may also point to EPS. Abdominal CT scanning can be helpful (as above). However, direct visualisation with laparoscopy and peritoneal biopsy are sometimes needed to confirm the diagnosis. Interesting reviews on the condition are here and here.


Martina McGrath MD

Wednesday, March 23, 2011

Hemodialysis Access Atlas

Here is a really excellent atlas covering all aspects of hemodialysis access function and malfunction which all renal fellows should read. We are indebted to Dr. Tushar Vachharajani, Marianne Neumann RN, and everyone at fistulafirst (www.fistulafirst.org/) for providing us with this wonderful resource. Please credit the authors if you intend to reproduce any of the content.

Tuesday, March 22, 2011

eKt/V

As previously discussed on RFN, the single pool Kt/V (spKt/V) was developed by Gotch and Sargent in a reanalysis of the NCDS data in an attempt to distinguish the dose of hemodialysis associated with improved outcomes.


The spKt/V model assumes that the human body acts like a “single pool” with a single concentration of urea. The model describes what happens when the dialysis machine is attached to the single pool and removes some of that urea (figure 1).


Each time the fluid comes into the dialyzer, some of the urea is removed and the remainder is returned to the pool. So over time the dialysis machine is fed fluid with progressively lower urea concentrations. As the dialysis treatment proceeds less urea is removed for any given volume.


For example, if at the start of the run the machine is clearing 100 ml/min (1 dl/min) and the concentration of urea is 100 mg/dl, 100 mg of urea will be removed from the body in one minute. However, if towards the end of the run the concentration of urea is 40 mg/dl, only 40 mg of urea will be removed in one minute.


This constant fractional removal leads to a curvilinear decline in the urea concentration during the dialysis run as shown in figure 2 by the solid line. When the urea concentration is expressed as a logarithm the decline becomes linear (dotted line) with a slope of –K/V.


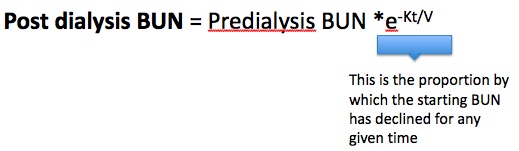
Using the starting BUN, the constant fractional decline and a set amount of time, one can figure out what the final BUN will be…


Remember that K = clearance in ml/min, t = time in minutes, and V = the volume of distribution of urea in liters leading to the dimensionless ratio Kt/V.


Rearranging…


Kt/V = -ln(R)


R = (post dialysis BUN/pre dialysis BUN). Plug in the numbers and see that a post dialysis BUN/pre dialysis BUN of 0.37 gives you a Kt/V of 1.0. A spKt/V of 1.0 means that the entire of volume of the single pool has passed through the dialyzer once.


The fancy looking Daugardis equation, mentioned last time for spKt/V, contains additional adjustments for urea generation during the dialysis run and urea removal that occurs from convection (i.e. clearance from ultrafiltration).


The spKt/V predicts urea concentration change as shown by the dashed line in the figure 3. However, what actually happens on dialysis is shown by the dots. The BUN drops faster than predicted during dialysis and rebounds more quickly afterwards. The net impact is that spKt/V overestimates the amount of urea removed during a dialysis session.


This occurs because the human body is not a single pool of urea. Instead, it has multiple compartments, each with unique rates of urea clearance. During dialysis the intravascular and interstitial spaces are cleared of urea rapidly while the larger intracellular space has lower urea clearance, as diagrammed in figure 4. This leads to the rapid decline in BUN during therapy.


Additionally, the entire blood volume can not be treated as a single compartment. Blood in the cardiopulmonary circuit cycles through the dialysis machine every 10-15 seconds while blood flowing through the peripheral limbs may take several minutes.


After dialysis there is a rebound in urea concentration as intracellular urea leaks into the interstitial and plasma space and blood from poorly perfused regions mixes with the highly dialyzed central circulation.


The equilibrated Kt/V can be obtained by measuring the BUN 30-60 minutes after the end of dialysis. It provides a more accurate measure of dose by using a urea concentration that is more reflective of the concentration in the total body water as compared with spKt/V, which uses a concentration reflective of the extracellular compartment and central circulation.


Of course, having someone stay for an additional hour after their dialysis session ends is inconvenient. Luckily there are conversion equations from spKt/V to eKt/V as shown below (there are several available equations for doing this).


eKt/V = spKt/V [(t/(t + 35)]


Notice the importance of time for any given spKt/V. For example, with spKt/V held constant and varying the time from say 100 minutes to 200 minutes the eKt/V will go from 74% to 85% of the spKtV. The longer you run the closer eKt/V will be to spKt/V (figure 6).


In the Hemodialysis (HEMO) Study published in 2002, 1846 patients were randomized to either high or low flux dialysis membranes and standard or high dose 3x per week dialysis. The dose targets were in eKt/V calculated from spKt/V. As mentioned above, eKt/V was used because it is a more accurate reflection of dose.


The achieved mean eKt/Vs in the standard dose and high dose groups were 1.16 and 1.53 respectively with mean spKt/Vs in the same groups of 1.32 and 1.71. There were no differences between groups in the primary outcome of death from any cause.


As I’m sure you’ve noted NCDS and HEMO where both trials of 3x week hemodialysis schedules. What if we want to compare dose between more or less frequent dialysis? Up next, stdKt/V…

Monday, March 21, 2011

Eculizumab – role in refractory antibody mediated transplant rejection

Eculizumab is a humanized monoclonal antibody that binds to and prevents activation of the C5 complement protein. As you may remember, this protein is critical to the formation of the membrane attack complex (MAC) in complement dependent immune activation.

Eculizumab has been licensed for the treatment of paroxysmal nocturnal haemoglobinuria (PNH), and has proven efficacy in reducing intravascular haemolysis, reducing transfusion requirements and stabilizing haemoglobin concentrations. However, it is very expensive and may require life-long treatment in these patients, as it does not alter the underlying cause of PNH.

It has been used off label in the renal transplantation setting for the treatment of refractory humoral rejection. An interesting case report highlighted it’s use. Severe antibody-mediated rejection (AMR) occurred following a living related renal transplant in a highly sensitized patient, who required pre-transplant plasmapheresis and IVIg for the presence of preformed donor specific antigens (DSA). Flow crossmatch was negative at time of transplantation, but became positive again on day 6 due to DSA against the donor A2 antigen, necessitating further plasmapheresis and IVIg. Renal function deteriorated and biopsy was consistent with severe AMR.
On day 10 he was given eculizumab and rituximab, with a temporary hold on plasmapheresis to prevent removal of the administered drugs. Within 48 hours his urine output had increased and by five days his creatinine began to decline. Plasmapheresis and IVIg were restarted in order to deal with the persistent DSA. Although it is impossible to ascribe the recovery solely to eculizumab, a follow-up biopsy illustrated markedly decreased staining for the MAC, at least supporting the efficacy of eculizumab in reduction of inflammation.

Due to the central role of the complement system in fighting infection, it is recommended that patients are given the N. meningiditis vaccine prior to treatment with eculizumab. This novel drug may have a potential role in the treatment of resistant humoral rejection in the future, but a major limiting factor is the cost. There is little long-term safety data in the treatment of immunosuppressed patients with eculizumab at this point in time.

Friday, March 18, 2011

Imipenem - why can't we use it alone?


Imipenem is a beta-lactam antibiotic that has a wide spectrum of activity against gram negative and gram positive organisms and is commonly used in an ICU setting. It is always given in combination with Cilastatin and in most of the documentation that you find online about this drug, it says that they are co-administered to increase the plasma levels of imipenem. This is not exactly true and this is where the story gets interesting from a renal point of view.

When given alone, imipenem is filtered in the glomerulus and when it reaches the proximal tubule, it is metabolized by a brush-border enzyme called dehydropeptidase I. As a result, under normal circumstances, only 5-20% of it is excreted unchanged in the urine. The metabolites of imipenem are very toxic to the proximal tubular cells and cause tubular necrosis and as a result, the drug on its own would not be useful due to its toxicity. Cilastatin inhibits the action of dehydropeptidase I, allowing the drug to be excreted unchanged in the urine and when they are given together, more than 70% of the drug reaches the urine. Some of the unmetabolized drug is reabsorbed but the peak levels increase by less than 20% and there is no alteration in the half-life. Thus, the major role of cilastatin is to prevent nephrotoxicity and increase the urinary concentration of imipenem.

So this begs the question of how it was determined that this was how the drug was metabolized. In early animal trials, the investigators noted that, despite the fact that it should be readily filtered at the glomerulus, the urine levels of imipenem were consistently far lower than would be expected given the serum levels. This could indicate that the drug was being metabolized elsewhere than the kidney but the rate of metabolism of the drug decreased significantly when the renal arteries were ligated. Finally, using porcine kidneys, the investigators determined that the enzyme responsible was dehydropeptidase I and developed cilastatin as an inhibitor of the enzyme to be co-administered with the drug.

This is the original paper concerning the pharmacokinetics of imipenem. An interesting historical renal perspective on a commonly used drug.

Wednesday, March 16, 2011

The Diet Pill and the Deadly Acidosis

I was recently called to evaluate an obese patient with profound metabolic acidosis who was admitted to the hospital with change in mental status and poor oral intake for several days. Her admission labs revealed severe hyperglycemia (glucose 776 mg/dL) and normal anion gap hyperchloremic metabolic acidosis (serum pH of 7.11 and serum bicarbonate of 7 mmol/L). She was initially suspected as having diabetic ketoacidosis due to miscalculation of the anion gap by the admitting team who used the corrected serum sodium and not the actual sodium, and as expected, her acidosis did not resolve despite the correction of hyperglycemia with intravenous fluids and insulin.
Her urine pH was 6.2, urine anion gap was 12 (no ketonuria) and fractional excretion of bicarbonate was 17% suggesting the possibility of mixed renal tubular acidosis. The case appeared like a puzzle until close questioning with the family revealed that her primary care physician had started the patient on topiramate (200mg/d) few weeks back for obesity. Interestingly, there has been a recent increase in literature about the risk of hyperchloremic metabolic acidosis in adult patients on topiramate therapy.
Topiramate is primarily approved for use as an anticonvulsant in patients with partial and generalized seizures and for migraine prophylaxis but its use as an antiobesity drug is among the several “off label" indications. In clinical trials, up to 32% of patients receiving topiramate 400mg/d in divided doses had evidence of normal anion gap metabolic acidosis and up to 7% had moderate to severe metabolic acidosis (less than 17 but greater than 5 mmol/L).
So, how does topiramate cause hyperchloremic normal anion gap metabolic acidosis? Carbonic anhydrase (CA) catalyzes the conversion of CO2 to HCO3- and H+ ion in the proximal tubule and in the type A intercalated cell of the cortical collecting duct. CAII is the most predominant isoform of CA present in the kidneys.Topimarate has been shown to inhibit the CAII activity thereby causing increased excretion of filtered bicarbonate leading to proximal renal tubular acidosis and impairment of the distal acidification leading to distal renal tubular acidosis. Patients with topimarate induced metabolic acidosis therefore tend to have an alkaline urine, positive urine anion gap, low urinary citrate levels indicating distal renal tubular impairment and increased fractional excretion of bicarbonate with elevated B2 microglobulinuria suggesting proximal tubular impairment.
Besides metabolic acidosis, topimarate use has been associated with 10 fold increased risk of nephrolithiasis and is largely due to hypocitraturia that develops in these patients with failure of renal acidification. These patients are also at risk for osteoporosis for the same reasons. Non ambulatory patients, ketogenic diets, hypovolemia and higher dosage (400mg/d) is associated with an increased risk of renal complications as outlined above. Although measurement of topiramate levels (3-25mcg/ml) is useful in diagnosing toxicity, one third of patients with therapeutic levels have evidence of hyperchloremic metabolic acidosis.
Topiramate induced metabolic acidosis usually improves with discontinuation of the drug. Baseline and periodic laboratory monitoring is needed to evaluate the patients for the development or worsening of metabolic acidosis. Prophylactic alkali therapy seems reasonable but has not been systematically studied.
Coming back to our patient, it became quite apparent that hypovolemia due to poor oral intake and osmotic diuresis probably contributed to the severity of the hyperchloremic metabolic acidosis which resolved 5 days after discontinuation of the drug and bicarbonate supplementation. Her altered sensorium also cleared. The topiramate level was not sent in a timely manner to be of any clinical utility.
Viresh Mohanlal, MD.

Monday, March 14, 2011

Diuretics in acute decompensated heart failure – evidence?

A randomized controlled trial of loop diuretics was published in NEJM two weeks ago. The trial involved 308 patients, from 26 clinical sites. The details are below:
Type:
Prospective double-blind randomized controlled trial (intention to treat analysis)

Inclusion:
Enrollment within 24 hrs of admission with ADHF
Clinical diagnosis of heart failure
History of chronic heart failure and receipt of an oral loop diuretic for at least 1 month before hospitalization, at a dose between 80 mg and 240 mg daily in the case of furosemide (or equivalent loop diuretic)

Exclusion:
SBP <90mmHg

Serum creatinine > 3mg/dL
IV vasodilators or IV inotropic agents

Intervention:
2 x 2 factorial design; 1:1:1:1 randomization, stratified on centre
High dose (2.5 x home diuretic dose) vs low dose (home oral dose)
AND
Continuous vs bolus dosing (every 12 hours) of loop diuretics
At 48 hours, the treating doctors could increase the dose by 50% (remaining blinded), make no changes (remaining blinded) or change to open-label oral diuretics

Primary Outcome:
Efficacy – global assessment of symptoms from baseline to 72 hours
Safety – change in serum creatinine from baseline to 72 hours
As these were co-primary endpoints, p<0.025 for each was required>

Results:
There were no significant differences in the either the primary efficacy or safety endpoints
between continuous vs bolus dose, nor between high vs low dose diuretics.
The patients in the high-dose group had greater relief of dyspnoea and had higher net fluid loss; however, this was offset by a greater increase in serum creatinine after 72 hours.
This is the first major trial examining the efficacy of loop diuretics in modern-day treatment of acute decompensated heart failure. It certainly is thought provoking in terms of its clinical applications and generalizability. Perhaps the first thing to note is that it excludes the sickest patients - those that need inotropes or vasodilators - patients who may be most likely to benefit from aggressive diuresis.
The use of a visual-analogue scale as a measure of symptoms seems a little hard to interpret as a primary efficacy endpoint of diuretic therapy – the editorial suggested it may be too insensitive also.
From a dosing point of view – it does not appear that subjects were given a bolus before a continuous infusion was started, something that we were always taught to do. In the bolus group, another point we were told during training is that 12 hour intervals may be too long – when a threshold dose of a loop diuretic is reached, the frequency of dosing should be increased in order to exert maximum effect. Again, major evidence is lacking for these proposed dosing strategies.
Although not powered to examine mortality, there were no differences in outcomes between the various strategies. A total of 130 patients died, were re-hospitalized or required an ED visit within 60 days. This really hits home that a lot more work is required to improve the outcomes of this patient subgroup. I’m sure this trial will receive a lot of attention from experts in the field and invite further research ideas.

Thursday, March 10, 2011

World Kidney Day 2011

Happy World Kidney Day 2011!  
This years theme is- 

protect your kidneys, save your heart.  

World Kidney Day began in 2006 and has continued to grow each year.  While every other organ system/disease has had a day/month for quite some time, it took a while to add our favorite organ (the kidney) to this list.  Here are the last 5 themes for world kidney day.

2006  Are your kidneys OK?
2007  Common, harmful and treatable
2008  Amazing kidneys
2009  Protect your kidneys: Keep your pressure down

This years theme is fitting because chronic kidney disease (CKD) alone has been established as an independent risk factor for cardiovascular disease (CVD). A nice editorial from ISN/International Federation of Kidney Foundations World Kidney Day Committee is published online for free here outlines the lack of attention CKD is given by world governments and public health authorities. This day helps give much needed attention to CKD and hopefully will lead to more awareness and eventually more therapies. Increased recognition of CKD will hopefully lead to more aggressive therapies for blood sugar, blood pressure and cholesterol. Which will in turn will lead to few patients developing CVD and ESRD.
What else can World Kidney Day do? We have long recognized the 20- to 30-fold increase in CVD in patients with ESRD. Much attention has been given to ESRD care. However, we have done little to impact cardiovascular mortality in patients with ESRD. Again, World Kidney Day can help give more attention to this growing problem as well. Expanding home dialysis options (daily home hemo and peritoneal dialysis) for patients on hemodialysis. This will need to be tackled on many fronts 1. Physician training and acceptance  2. Increasing infrastructure at dialysis units to deal with patient training and call system for issues related to nocturnal dialysis  3. Educating the public to know that this option can be performed safely and effectively.  4. Improving reimbursement programs to allow providers to utilize these options.
Some of the fellows at Duke will be volunteering at the Raleigh NKF KEEP program this weekend to celebrate World Kidney Day.  Lets spread that word about kidney disease so we can reverse this growing epidemic!

World Kidney Day: Top 10 List

Nephron Power and Precious Bodily Fluids have nice kidney-related Top 10 lists for World Kidney Day.  Here's our list.

10.  One kidney= winning, two kidneys= bi-winning

9.    Most successful solid organ transplant. Living donor transplant is a viable option.

8.   Renal replacement therapy

7.   Glomeruli rule!

6.   Crystals

5.   When the going gets tough who you gonna call... the Nephrologist

4. The kidney is important for all other organs (heart, lung, bone, blood, vessels, brain)

3.  Poor man's kidney biopsy (urine microscopy)

2.  Many discoveries yet to be unraveled

1.  It's not a pump!

Happy World Kidney Day!!  Spread the word about the "amazing" kidney

Tuesday, March 8, 2011

PPI-Associated Hypomagnesemia

At renal grand rounds today, we heard about a case of severe hypomagnesemia in a patient who was on chronic omeprazole therapy. While the etiology of the low Mg2+ was likely multifactorial, I was surprised to find out that the PPI could have played a causal role. To date, there have been several case series of patients with profound hypomagnesemia that appeared to be due to PPI treatment. The most recent came from Hoorn et al, in which four patients with PPI-induced hypomagnesemia were described. All four had been on PPI therapy for at least one year, and serum Mg2+ ranged from 0.16 to 0.68 mEq/L before repletion. Hypomagnesemia resolved as early as two weeks after discontinuation of the PPI in one case, and took up to three months in another patient. Concomitant hypokalemia was also present in all four cases, and normalized with correction of the serum magnesium.

The mechanism of PPI-induced hypomagnesemia is unclear, although it is hypothesized that somehow the drugs interfere with gastrointestinal absorption. However, data from one case report suggest that a renal effect may also contribute. Regolisti et al described a patient with hypomagnesemia while on pantoprazole. An intravenous infusion of magnesium was used to determine the kidney’s maximum tubular magnesium reabsorption threshold, or the serum ultrafilterable magnesium concentration below which the kidneys retain most of the filtered magnesium. The serum and urine Mg were measured during a period of IV Mg infusion, and the point at which the urine Mg began to increase was deemed the point at which the renal tubular mechanisms for Mg reabsorption were overwhelmed. The maximum tubular reabsorption threshold for Mg was markedly less (0.90 mEq/L) in the patient compared to normal persons (≥ 1.20 mEq/L).

Although the incidence of PPI-induced refractory hypomagnesemia is assuredly quite low, given the infrequent case reports and the large number of people taking PPIs, it should be considered on the differential diagnosis of hypoMg (see Nate’s post) in any patient on a PPI whose low magnesium level is proving hard to correct.

Friday, March 4, 2011

PD – causes of blood in the dialysate

A recent post got me thinking of the differential diagnosis of blood-stained peritoneal dialysis effluent. I thought it would be interesting to share some of the differentials and to remember that the Tenchkoff catheter can truly be a window to the abdominal cavity.
Blood-stained PD fluid can be dramatic and frightening for both patient and doctor alike. As little as 4-5mls of blood can be enough to cause grossly apparent colour changes in the fluid. A very succinct review can be found here.
Catheter related conditions
- Catheter insertion, manipulation and trauma/pulling of the external limb of the catheter can all cause local tissue damage at the peritoneal entry site, which could lead to blood staining.
- Insertion related trauma to intra-abdominal organs and/or vasculature can also cause more serious and more persistent bleeding. This may be reduced by laparoscopic assisted placement of catheters, which allows more direct visualization of the catheter during insertion. The risk of bleeding obviously increases if patients have significant adhesions and previous surgeries (often relative contraindications to successful PD anyway).
Menstruation
In female patients menses accounts for around one third of cases of haemoperitoneum associated with PD. This of course varies with age. The menstrual history is an important area to ask about during history taking from female PD patients. Ovulation can also result in haemoperitoneum.
Obstetric related
Lacerations of the gravid uterus by the PD catheter have been proposed as a possible rare cause for bloody PD fluid during pregnancy.
Other intra-abdominal organ pathology
Rupture cysts from ADPKD have been proposed to cause bloody PD fluid, despite their retroperitoneal location. It’s postulated that superficial cysts may form adhesions with the peritoneal cavity, allowing access after cyst rupture.
Liver and splenic lesions may cause bleeding into the peritoneal cavity – e.g. tumours, cysts, rupture and trauma. Bloody dialysate has rarely been reported after colonoscopy procedures also.
Surgery
Intra-abdominal surgery has been well recognized to lead to bloody PD fluid. The tendency to bleed may be enhanced by advanced uraemia and by the coexistence of any coagulopathies.
Of note gross haematuria is rare with infectious aetiologies of peritoneal disease. However, it is important to take advantage of the relative ease of acquiring a fluid sample when a PD patient presents with abdominal pathology. Remember that we can check for more than just white cells in a PD fluid sample – we can also look for red cells, amylase and abnormal cytology as just a few examples of additional tests. Putting all these clues together may lead us to an alternative and interesting diagnosis.

Thursday, March 3, 2011

Thrombosis and the nephrotic syndrome

Should patients with nephrotic syndrome (NS) be anticoagulated? Is there any level of proteinuria or albumin at which we should be especially concerned?

The rates of venous thromboembolism (VTE) have ranged from 8-44% in observational studies and it is estimated that patients with NS are 8 times more likely to develop a clot than the general population and that this risk is highest in the first 6 months after diagnosis (140 times the general population or 9.8%). The risk appears to be higher in patients with severe NS; in one study of 89 patients with NS and an albumin of less than 2.0, 31% of patients were found to have PE on pulmonary angiogram.

There are a number of potential mechanisms for the hypercoagulable state seen in patients with NS:

- Increased platelet aggregation: There are a number of potential mechanisms for this including increased production of thromboxane A2 (arachidonic acid is normally albumin-bound and hypoalbuminemia leads to increased availability) and high LDL levels (which appears to independently increase platelet aggregation). There also seems to be an increase in interactions between platelets and the vascular endothelium with increased levels of circulating markers of platelet activation

- Defects in the clotting system: Loss of antithrombin in the urine (serum antithrombin levels correlate with albumin levels in patients with NS). Elevated protein C and protein S have also been noted in patients with NS

- Impaired fibrinolysis: Plasminogen levels are decreased in NS and correlate with proteinuria. Albumin is itself is a cofactor for plasminogen binding to fibrin and thus its lack may contribute to impaired fibrinolysis.

- Etiology of the Nephrotic Syndrome: It appears that patients with membranous nephropathy, MPGN and minimal change disease are more at risk of VTE than patients with other causes of NS. The reason for this is uncertain and the risk is particularly high with membranous nephropathy.

Click to enlarge

Unfortunately, there are no tests that can accurately predict the risk for VTE in patients with NS. It has been suggested prophylactic anticoagulation should be considered in patients with an albumin of 2.0 although this is based on opinion rather than evidence. There is some suggestion that treatment of the hyperlipidemia associated with NS can reduce platelet aggregation and similarly, prophylactic aspirin should be considered although, again, there are no trials proving its efficacy. Overall, although the risk of of VTE in patients with NS is 8 times the general population, this is still less than 1% per year and given that the risk of major bleeding with warfarin is greater than this, it is hard to justify routinely anticoagulating all patients. Perhaps if we had a better measure of risk we could better stratify these patients and select those who would benefit most from anticoagulation early.

Here is a recent review of the topic the picture above is from this review

Wednesday, March 2, 2011

Pregnancy in the Dialysis Patient

While recently reading about hypogonadism in the dialysis population, I came across this review on the pregnancy outcomes in women on dialysis, summarizing observational studies published between 1995 and 2009. I have participated in only a few pregnancy-planning discussions with women with CKD, but they have all been emotionally tough. None of my patients were dialysis patients, however, whom I would have predicted would have even worse outcomes with pregnancy as has been reported for CKD (for example, a rate of preterm delivery of 63% and perinatal death of 4% reported recently here).


The results of this review suggest that the outcomes in women on dialysis, while better than expected in some aspects (for example rate of live birth of 79%), still carry significant risks for the mother and baby (for example, a perinatal death rate of 17.6%).


Among women of childbearing age on dialysis, DaVita reports that only 1-7% can get pregnant – due to complete cessation of the menstrual cycle, or anovulatory cycles. However, some women continue to have menstrual cycles – as you’ll be smart to remember next time you’re asked about a female PD patient with a bloody peritoneal fluid effluent.


Among those who do get pregnant (222 pregnancies studied in this review), an astonishing 79% resulted in a live birth, although only 8% were term births (71% were premature for an overall preterm delivery rate of ~85%!). The two most common reasons for premature birth were premature labor (approximately 1/3rd) and fetal distress (another 1/3rd). Of the remaining 1/3rd, intrauterine growth restriction and hypertensive disease were most common. The rate of delivery by c-section in the subgroup where this data was available, was 37%.


Among the fetal/neonatal complications, prematurity was most common. Three cases of fetal abnormalities were reported, including one case of right-sided pulmonary agenesis. The rate of polyhydramnios was 32%, postulated to be due to increased diuresis by the fetal kidneys due to elevated urea. There were 19 neonatal deaths and 28 perinatal deaths among 159 live births for which this data was reported, yielding a neonatal mortality rate of 11.9% and perinatal mortality rate of 17.6%. It is not clear if perinatal mortality includes neonatal mortality in this article, though the latter percentage by itself is a sobering figure.


Among the maternal complications, hypertensive disease was the most common, though at a reported 30% it is much lower than I would have predicted. Among the 14 women in the cohort on PD, 4 developed peritonitis and 2 developed uterine bleeding so significant to require surgical intervention and, in one case, hysterectomy. The specific adjustments to renal replacement management for pregnant women were not discussed in detail, though included increased time and frequency of dialysis, which was associated with decreased rate of polyhydramnios and improved fetal outcomes.


As it is still a relatively rare event, I would love to hear from any of you who have helped manage pregnant women on dialysis.


Marta Hristova MD